 |
|
 |
|
Graphing with Extrema
|
Versatility
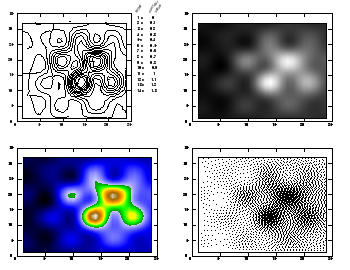
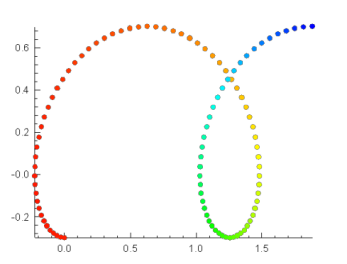
Extrema can output a wide variety of graph types,
including 2-D and 3-D line graphs, contour and
density plots, surface plots, bar charts, histograms, and more.
|
|
|
Flexibility
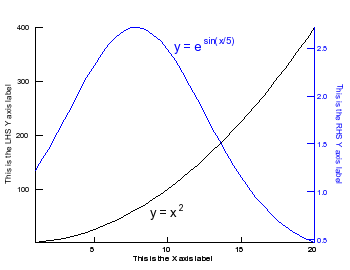
Every detail of the output is under user control, including colors,
fonts, point types, axis placement, tic size and angle, scales, line
types, graph labels, size and placement of the graph, and more.
Graphs can be overlaid and combined even when they have different
scales and units. Acceptable defaults are provided automatically, so
you don't have to think about the details until you need to.
|
|
Sophistication
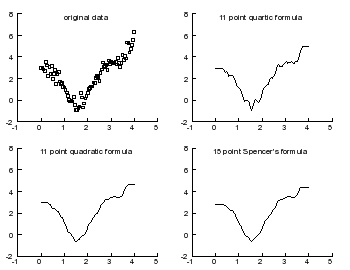
Extrema has over 200 numeric and character functions, and over 30
operators, providing all of the operations of simple calculus, along
with powerful curve fitting, filtering, and smoothing techniques.
|
|
|
Power
Extrema can handle data sets of unlimited size, can accurately fit to
arbitrary functions with an unlimited number of free parameters, and can
evaluate algebraic expressions of any complexity. For complex
data analysis procedures, Extrema has its own easy-to-learn
programming features, including conditional branching, looping, and
subroutine calling constructs.
|
Click here for a detailed Extrema feature list.
|
|
 |
|
 |


